
Precise and timely identification of crop types has numerous applications in environmental research, economy, agriculture, and policy-making.
Crop-type mapping is key to improving crop monitoring and field management tasks, such as fertilization, irrigation, etc. In water-scarce regions, crop classification maps become an important data source for monitoring the spatial distribution of water usage, predicting water deficiency risks, and assessing the consequent food insecurity.
Historical knowledge of the crop types grown in the cultivated land opens access to “green payments” and similar governmental initiatives supporting farmers who practice crop diversification or other environmental-friendly growing techniques.
Remote sensing solutions
Remote sensing has been exploited for identifying the spatial distribution of crops for over thirty years. The emergence of advanced satellite sensors, AI technology, and computing have turned it into a powerful tool for accurate and fast crop types classification based on satellite data compared to traditional, time-consuming on-field surveys. Boots-on-the-ground scouting serves as a means to validate the accuracy of satellite observations and distinguish crop classes more efficiently.
The temporal and spatial resolutions of the available public and commercial satellite imagery are only getting higher, which enhances the precision of identifying spectral signatures of crops, i.e. the unique way in which every plant species absorbs and reflects the radiation.
Crops tend to have a different spectral response at different stages of maturity in remotely sensed imagery, so building a crop type-specific temporal record would require a high frequency of satellite revisits to the area of interest.
To that end, most satellite solutions for crop classification use a combination of optical and radar (cloud-free) spaceborne data to have as few temporal data gaps as possible.
Crop classification with EOSDA
EOS Data Analytics is a global provider of AI-powered satellite data analytics solutions. It is best known for its agriculture-focused product EOSDA Crop Monitoring with registered users in all 195 world countries, however, the company also provides a number of custom solutions tailored to client needs. Among them is crop type classification.
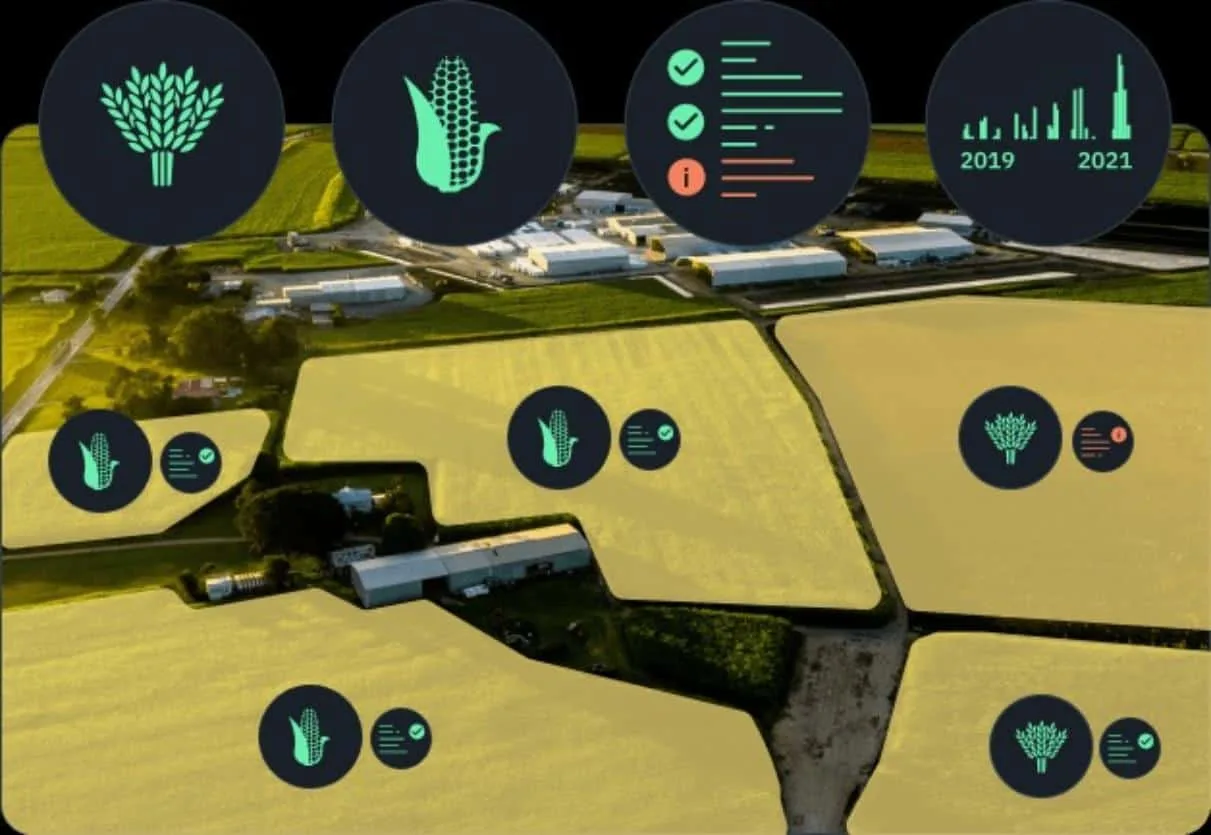
Using a combination of optical and synthetic aperture radar (SAR) imagery and ground truth data for neural network training, EOS Data Analytics team of R&D specialists can provide a crop type map for fields the size of several hectares. The accuracy depends on the availability of reliable input data for the ML model and goes up to 90%.
There are multiple scenarios where crop classification maps provide valuable information:
- Crop type maps of large cultivated areas are part of the inventory preparation at a national or regional level. They allow for estimating the development and productivity (potential yield) of specific crops, collecting crop-related statistics, assessing crop damage due to weather extremities, etc.
- Data on cultivated crop types enable cost-effective crop monitoring and management at the field or region level. It is possible to derive crop-specific management zones and make better-informed management decisions.
- Historical crop rotation records aid in mapping out the planting arrangement for each subsequent growing season, which is beneficial for soil fertility, pest and disease resistance in plants.
- Crop type identification using remote sensing solutions speeds up the validation of farmer insurance claims. Earth observations from space help pinpoint areas of potential non-compliance and initiate field investigation.
Advantages of the EOSDA approach to satellite analytics
As a constantly evolving method with a lot of studies and experiment work going on, the classification of crop types using remote sensing technology has some limitations to it.
Having years of precision agriculture experience and inside-out knowledge of AI algorithms and remote sensing applications, EOSDA team finds optimal solutions to tackle all related challenges.
To achieve the highest possible accuracy, regular captures over the area of interest are required. Optical imagery is sensitive to weather conditions, so during certain seasons and weather events (rainfall, snowfall, etc.), Earth observations get obstructed by clouds, which creates gaps in necessary input data.
The crop classification algorithm used by EOS Data Analytics relies on one more source of satellite imagery – SAR data. It is obtained by satellite sensors that emit their own microwave radiation and can “see” Earth’s surface through the clouds and even at night.
Numerous satellite solutions for crop-type mapping rely on time-series imagery, which plays a significant role in extracting crop distribution information. Mapping the crops grown even in a tiny field requires a lot of satellite data processing and can make it difficult to scale for large agricultural areas.
That isn’t the case with EOSDA custom solutions. The company boasts a large assortment of pre-trained ML models that can be easily adjusted to perform crop type classification in a new region or for a new plant species and quickly produce the results.
Case studies: detection of sugarcane mills in Brazil
One example that the flexible approach of EOS Data Analytics to crop classification yields positive results and meets customer needs is the sugarcane project for Brazil.
The company’s specialists were entrusted with two tasks: to classify sugarcane mills and detect the harvested sugarcane in a specified cultivated area of São Paulo state.
Mill classification can provide farmers with information about the available sugarcane amounts and help estimate the potential of future mills while land exploration or expansion to new markets. The knowledge of exact harvested acreage, in its turn, makes for more careful planning of field works, storage capacity, and logistics.
To classify sugarcane mills with their own remote sensing solutions, specialists tested the convolutional LSTM (Conv-LSTM) and BiLSTM (bidirectional recurrent neural network based on LSTM).
Data from ten different countries comprising a million hectares of ground truth data and satellite imagery (Sentinel-1, 2, MODIS Terra) were used to create a training and labeling dataset. The Conv-LSTM produced better results reaching a 94% accuracy rate.
To fulfill the task of detecting the harvested field index for 6,500 fields covering 47,000 hectares, EOSDA team collected Sentinel-1 and Sentinel-2 imagery that was acquired at consistent intervals.
NDVI analysis helped to identify the field parts with rapid drops in the crop’s green biomass followed by low index values that indicated the harvested plots. They were reporting on the status of harvesting every 10 days and also managed to forecast the harvesting dates for 10% of all fields.
Modern computing and analytics technologies take crop type classification methods to the next level, saving processing time, enhancing the accuracy of results, and creating opportunities for new use case scenarios.